
How to Read a Nutrition Label: Every Section Explained for Smarter Weekly Eating
Most people read nutrition labels the same way: glance at the calories, feel vaguely informed, and move on. They miss the serving size trap — eating two and a half servings of something while calculating the nutrition for one. They skip the % Daily Value column entirely because nobody ever explained what 5% or 20% actually means. And they have no idea that the nutrition label they memorized a decade ago was substantially redesigned in 2020, with a new mandatory line that changes how you evaluate almost every packaged food in the grocery store.
The nutrition facts label is a standardized FDA-mandated document. Every number on it means something specific. Every section serves a distinct purpose. Reading it fluently does not require a nutrition degree — it requires understanding eight sections in the order they appear, one time, with enough context to make the numbers mean something.
This guide walks through every section of the current FDA nutrition label in the order it appears on the package. The most important number most people completely ignore is the one printed at the very top — before the calories, before the fat, before anything else. It is the number that makes every other number on the label either accurate or completely misleading.
What is a nutrition facts label and what does it show?
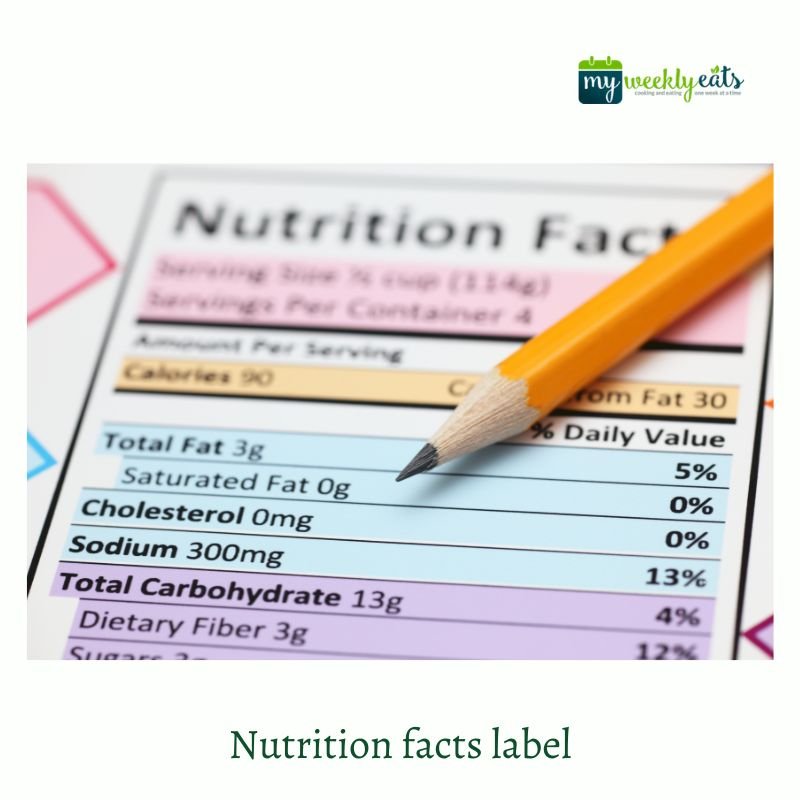
| Quick AnswerA nutrition facts label is a standardized FDA-mandated panel on packaged food showing serving size, calories, macronutrients, micronutrients, and % Daily Values per serving. It gives you the precise nutritional content of what you eat, standardized across every packaged food in the US. |
The nutrition facts label exists because of the Nutrition Labeling and Education Act (NLEA) of 1990 — a federal law requiring standardized nutritional information on virtually all packaged foods sold in the United States. It is not a marketing document. It is not optional. It is a legal requirement, and its format is specified down to font size and layout by the FDA.
The current label — the version on shelves since the 2020 FDA update — shows eight mandatory sections in a fixed sequence. Serving information sits at the top because it governs every other number. Calories follow. Then the macronutrients the FDA has identified as most relevant to public health, broken down by type. Then the micronutrients — four of which are now required by law based on current US deficiency data. The footnote at the bottom decodes the entire panel with a single rule most people have never read.
| Why the 2020 label matters: If you memorized the old label, your knowledge has a gap. The new version added a mandatory added sugars line, replaced vitamins A and C with vitamin D and potassium, updated daily values for sodium and fiber, and made calorie text larger and bolder. Section 8 of this guide covers every change in full. |
The label does not tell you whether a food is healthy. That is a judgment call that depends on your total diet, your health context, and how a food fits into your week. What the label does is give you verified, standardized data to make that judgment yourself. The eight sections below show you exactly how to use it.
Here is the full label structure — what each section shows and the single most important thing to know about it:
| Label Section | What It Shows | The One Thing to Know |
| ① Serving Size + Servings Per Container | Standard unit; all other numbers are based on this | This is the most-missed number on the label. If you eat two servings, every number doubles. Check this before anything else — always. |
| ② Calories | Energy per serving | 200 calories of lentils and 200 calories of chips are nutritionally incomparable. Calories matter in context, not in isolation. |
| ③ Total Fat (+ Saturated, Trans, Unsaturated) | Fat type and amount per serving | Saturated fat and trans fat are the watch items. Unsaturated fats (mono and poly) are beneficial. Total fat alone tells you nothing useful. |
| ④ Cholesterol + Sodium | Mg per serving of each | Sodium is the most over-consumed mineral in the US diet. The Daily Value is 2,300 mg/day. One meal at a fast-food restaurant often hits that limit alone. |
| ⑤ Total Carbohydrate (+ Fiber, Total Sugars, Added Sugars) | Carb breakdown including the new added sugars line | Dietary fiber is a benefit — aim high. Added sugars are the new mandatory line (2020 update) — aim low. These two numbers tell opposite stories inside the same section. |
| ⑥ Protein | Grams per serving | No % DV appears by default for protein. Compare gram amounts across products. For plant-based eating, this number guides your protein sourcing across the week. |
| ⑦ Vitamins & Minerals | Vitamin D, Calcium, Iron, Potassium (required); others optional | The 2020 label replaced vitamins A and C with vitamin D and potassium — reflecting where US deficiencies actually exist today, not in 1993. |
| ⑧ Footnote / % DV Key | The 5%/20% rule that decodes every other number | Most people skip the footnote. It is the most important line on the label. 5% DV or less = low. 20% DV or more = high. Learn this once and reading any label takes seconds. |
How do you read a nutrition label step by step?
| Quick AnswerStart with serving size — every other number on the label multiplies by how many servings you eat. Then move to calories, then the ‘get less’ nutrients (saturated fat, sodium, added sugars), then the ‘get more’ nutrients (fiber, vitamin D, potassium). Read the ingredients list last to verify what the front of the package actually claims. |
Reading a nutrition label is a six-step process. Most people skip step one. That single omission makes every other number they read meaningless.
Step 1 — Serving Size: The Number That Changes Everything
Before any calorie, gram, or percentage on the label means anything, find the serving size. It is the first line of the label for a reason. If the container shows 2.5 servings and you eat the whole thing, you must multiply every number on the panel by 2.5. The 200 calories becomes 500. The 14% DV for sodium becomes 35%.
This is not a theoretical problem. A standard 20 oz bottle of soda is labeled as 2.5 servings in older formats. A bag of chips that looks like a single-serve snack often contains two servings. The FDA’s 2020 label update introduced dual-column formatting for packages likely consumed in one or two sittings — showing per-serving and per-package values side by side — precisely because the multi-serving trap was so consistently misread.
Step 2 — Calories: A Reference, Not a Decision
Read the calorie count as a data point, not a verdict. Two hundred calories of white rice and 200 calories of cooked lentils carry completely different nutritional profiles — different fiber content, different protein levels, different micronutrient contributions. Calories measure energy density. They do not measure nutritional quality.
Use calories to understand portion relationships and to compare similar products. A 300-calorie breakfast that delivers 10 g fiber and 15 g protein is a different meal than a 300-calorie breakfast that delivers 1 g fiber and 3 g protein, even though both read the same on the calorie line.
Step 3 — The ‘Get Less’ Column
Scan the label for four numbers you want to see low: saturated fat, trans fat, sodium, and added sugars. These are the nutrients most consistently over-consumed in the US diet. For any of these, a % Daily Value of 20% or more in a single serving is a significant contribution to your daily limit — and a signal worth paying attention to.
Trans fat deserves special treatment. There is no established safe daily level for artificial trans fat. Any amount listed on the label is worth investigating. Check the ingredients list for “partially hydrogenated oils” — the source of artificial trans fat and the ingredient to avoid regardless of what the front of the package claims.
Step 4 — The ‘Get More’ Column
Dietary fiber, vitamin D, calcium, iron, and potassium are the nutrients most under-consumed by US adults, according to federal dietary data. For these, a % DV of 20% or above per serving is a genuine nutritional benefit. A % DV of 5% or less means the food contributes little of these nutrients and should not be your primary source.
This is where the label becomes genuinely useful for weekly meal planning. A food that delivers high % DV for fiber and potassium alongside low % DV for sodium and added sugars is objectively a better nutritional choice than the reverse — regardless of what the front-of-package marketing says.
Step 5 — Protein
Note the grams of protein per serving. The label does not show a % Daily Value for protein by default — it only appears when a product is marketed to infants, children under four, or when the label makes an explicit protein content claim. Compare gram amounts directly between products. For plant-based weekly meal planning, tracking protein across the day’s meals is more useful than evaluating any single food in isolation.
Step 6 — Ingredients List
Read the ingredients list last, after the numbers. Ingredients appear in descending order by weight — the first ingredient is what the food contains most of. The first three ingredients define what the product actually is. A bread with “enriched wheat flour” first and “whole wheat flour” third is primarily white bread with token whole grain — regardless of what the package says.
Use the ingredients list to verify front-of-package claims, identify hidden added sugars under their 60+ alternative names, and assess how processed a product is. Foods with shorter, recognizable ingredient lists tend to be less processed — not universally, but consistently enough to serve as a practical shortcut.
| The 5%/20% shortcut: You do not need to memorize daily values for every nutrient. One rule covers everything: 5% DV or less is low for that nutrient in one serving. 20% DV or more is high. Apply it to every line on the label — for both the nutrients you want more of and the ones you want less of. The next section explains how to use it nutrient by nutrient. |
What does % Daily Value mean on a nutrition label?
| Quick Answer% Daily Value shows how much of a nutrient one serving contributes to a standard 2,000-calorie daily diet. The rule: 5% DV or less is low; 20% DV or more is high. Use this rule to decide whether a food is a meaningful source of a nutrient you want — or a significant contributor to something you want to limit. |
% Daily Value is the most powerful reading tool on the nutrition label. It converts raw gram and milligram amounts — numbers that are meaningless without context — into a single percentage that immediately tells you whether a nutrient is high or low in a given food. Most people look past it entirely.
The Reference Diet
% DV is calculated against a 2,000-calorie daily diet, as standardized by the FDA. This is a reference amount — not a prescription. People eating significantly more or fewer than 2,000 calories should adjust expectations proportionally. But for comparison shopping and daily tracking, the 5%/20% rule works reliably across all eating levels as a directional guide.
The 5%/20% Rule — Learn It Once, Use It Forever
5% DV or less means a food is low in that nutrient per serving. 20% DV or more means a food is high in that nutrient per serving. Everything between is moderate.
Apply this rule differently depending on the nutrient’s direction:
- For fiber, vitamin D, calcium, iron, and potassium: high % DV (20%+) is a benefit. These are nutrients most US adults under-consume. Seek them out.
- For sodium, saturated fat, and added sugars: high % DV (20%+) is a warning. These are nutrients most US adults over-consume. Watch them closely.
- For trans fat: there is no safe DV, so no % DV appears. Avoid any product that lists it at all.
This single rule makes label comparison genuinely fast. Two breakfast cereals, two pasta sauces, two yogurts — hold them up, compare the % DV for fiber and added sugars, and the better option is obvious in seconds.
What Doesn’t Have a % DV
Total sugars carry no % DV because they combine naturally occurring sugars (from fruit, dairy, vegetables) with manufacturer-added sugars — two very different nutritional situations that cannot share a single daily target. Added sugars now have their own % DV line (50 g/day) specifically to separate this distinction.
Protein does not show a % DV by default because protein adequacy varies significantly by age, body weight, and activity level. When a product makes a protein claim or is marketed for children, the % DV appears. Otherwise, compare gram amounts directly.
The % Daily Value reference below shows every key nutrient, its daily target, and whether to aim high or low:
| Nutrient | DV Reference | 5% = Low | 20% = High | Direction | Practical Rule |
| Dietary Fiber | 28 g | ≤ 1.4 g | ≥ 5.6 g | GET MORE ↑ | Every packaged food with 20%+ DV for fiber is a high-fiber choice. Legumes, whole grains, and bran cereals hit this regularly. |
| Vitamin D | 20 mcg | ≤ 1 mcg | ≥ 4 mcg | GET MORE ↑ | Most Americans are deficient. Fortified foods (dairy, plant milks, cereals) and UV-exposed mushrooms are the main food sources. |
| Calcium | 1,300 mg | ≤ 65 mg | ≥ 260 mg | GET MORE ↑ | Important for bone health across the lifespan. Tofu, fortified plant milks, and dark leafy greens contribute meaningfully. |
| Iron | 18 mg | ≤ 0.9 mg | ≥ 3.6 mg | GET MORE ↑ | Especially important for women and plant-based eaters. Pair iron-rich plant foods with vitamin C to improve absorption. |
| Potassium | 4,700 mg | ≤ 235 mg | ≥ 940 mg | GET MORE ↑ | Widely under-consumed. Sweet potatoes, legumes, leafy greens, and avocado are among the richest sources. |
| Sodium | 2,300 mg | ≤ 115 mg | ≥ 460 mg | GET LESS ↓ | Most US adults consume ~3,400 mg/day — nearly 50% over the DV. Canned foods, sauces, and condiments are the largest contributors. |
| Saturated Fat | 20 g | ≤ 1 g | ≥ 4 g | GET LESS ↓ | Evidence links high saturated fat intake to elevated LDL cholesterol. Animal products and tropical oils are the primary sources. |
| Added Sugars | 50 g | ≤ 2.5 g | ≥ 10 g | GET LESS ↓ | The 2020 label’s most important addition. One 12 oz soda delivers 60–80% of the DV in a single serving. |
| Trans Fat | No DV set | Any amount | Any amount | AVOID ✕ | There is no safe daily intake for artificial trans fat. Avoid any product listing partially hydrogenated oils in the ingredients. |
All DV figures reference Dietary Guidelines for Americans 2020–2025 and FDA nutrition label regulations (21 CFR 101.9). Values apply to a 2,000-calorie reference diet.
How do serving sizes on nutrition labels actually work?
| Quick AnswerServing size on a nutrition label reflects the amount people typically eat in one sitting, according to FDA reference amounts. It is not a recommendation — it is a measurement unit. Every calorie, nutrient gram, and % Daily Value on the label applies only to that serving size, not to the whole package. |
Where Serving Sizes Come From
The FDA sets serving sizes using Reference Amounts Customarily Consumed (RACC) — standardized amounts derived from federal food consumption surveys tracking what Americans actually eat. The 2020 label update revised dozens of RACC figures to reflect current eating patterns, not the consumption habits reported in early 1990s surveys.
Practical examples of what changed: the serving size for soda moved from 8 oz to 12 oz to reflect that most people drink a full can at once. Ice cream moved from 1/2 cup to 2/3 cup. Certain cereals moved from 3/4 cup to 1 cup. These are not recommendations to eat more — they are acknowledgments of reality that make calorie and nutrient calculations more accurate for how people actually eat.
Serving Size Is Not a Portion Recommendation
This distinction matters every time you read a label. The serving size tells you what measurement unit the label uses. It does not tell you how much to eat. A serving of peanut butter is 2 tablespoons. If you eat 4 tablespoons on your toast, you have eaten two servings — and you should double every number on the label to understand what you consumed.
Many packaged foods are designed to feel like single servings while technically containing two or more. Muffins, beverages, small bags of snack foods, and single-serve pasta trays are frequent offenders. The label is not trying to mislead you — it is following FDA RACC guidelines. But the practical effect is that serving size awareness is a skill that requires active attention, not passive reading.
The Dual-Column Label: A Major Improvement
For packages that could realistically be consumed in one or two sittings — a 3-cup container of ice cream, a 15 oz can of soup, a 20 oz bottle of juice — the FDA now allows (and in some cases requires) a dual-column label. The left column shows nutrients per serving. The right column shows nutrients for the entire package.
This format eliminates the most common label-reading error entirely. If you drink the whole bottle, you read the right column. No math required. Look for this format on beverages, single-serve containers, and small-package snack foods.
The Practical Calibration Exercise
| Do this once per food: Weigh or measure an actual serving of your most frequently eaten packaged foods — peanut butter, granola, salad dressing, cooking oil, pasta. Most people are genuinely surprised by how small a standard serving is. Doing this once per food item recalibrates your label-reading accuracy permanently — and changes how you understand calories without any counting system. |
What should you look for in the ingredients list?
| Quick AnswerThe ingredients list shows every ingredient by weight, from most to least. The first three ingredients define what the food actually is. Look for whole foods near the top, and watch for added sugars hiding under 60+ alternative names, highly refined oils, and artificial additives appearing in the first five positions. |
The First-Three-Ingredients Rule
Ingredients appear in descending order by weight before cooking or processing. The first ingredient is what the food contains most of. The second is what it contains second-most. By the time you reach the third ingredient, you have a reliable picture of what you are actually eating.
A granola bar with “rolled oats” listed first and “whole grain oats” second is primarily oats. A granola bar with “sugar” first and “corn syrup” second is primarily sweetener — regardless of what the front of the package claims about being a wholesome snack. The first three ingredients tell the truth that the marketing does not always tell.
60+ Names for Added Sugar
Food manufacturers use over 60 different names for added sugars in ingredient lists. The nutrition facts label now shows added sugars as a mandatory line — but the ingredients list remains where you discover which specific sugars were added and in what relative amounts.
The most common names to recognize:
- The ‘-ose’ family: fructose, dextrose, maltose, sucrose, glucose — any ingredient ending in ‘-ose’ is a sugar.
- The syrup family: high-fructose corn syrup, corn syrup, cane syrup, rice syrup, agave syrup, barley malt syrup — any ‘-syrup’ is typically a concentrated sugar source.
- The ‘natural’ disguises: cane juice, evaporated cane juice, fruit juice concentrate, honey, molasses, maple syrup, agave nectar — these are still added sugars regardless of how natural they sound.
When multiple sugar names appear in the first five ingredients, or when two or three different sugar aliases appear across the full list, the product likely contains a higher total added sugar load than any single ingredient’s position suggests.
Front-of-Package Claims vs. the Ingredients List
Regulatory language for front-of-package claims is less strict than the standardized nutrition facts panel. Claims like “multigrain,” “made with real fruit,” “natural,” “light,” and “low fat” are marketing statements with specific but often misleading technical definitions.
A “multigrain” product can be made primarily from refined flour with token amounts of secondary grains — and still carry that label legally. A “low fat” product can be high in added sugars to compensate for the removed fat. A “made with real fruit” product may contain a fraction of a percent of fruit juice concentrate among a list of processed ingredients.
The verification habit: when a front-of-package claim seems meaningful, open the nutrition facts panel and check the % DV for the relevant nutrients. Then read the first three ingredients. What you find in those two places is always more reliable than what the front says.
Ingredient List Length as a Rough Quality Signal
A shorter ingredients list does not guarantee a nutritious food — plain white sugar has one ingredient. But across comparable product categories, foods with fewer, recognizable ingredients tend to be less processed. A five-ingredient bread uses whole ingredients. A twenty-eight-ingredient bread uses stabilizers, conditioners, emulsifiers, and shelf-life extenders alongside the flour. Both are bread. They are not nutritionally equivalent.
What do added sugars, total sugars, and sugar alcohols mean on a label?
| Quick AnswerTotal sugars include naturally occurring sugars from fruit and dairy plus any sugars a manufacturer added. Added sugars are the manufacturer-added portion only — this is the number to watch. Sugar alcohols are a separate low-calorie sweetener category with partial digestibility and a smaller blood glucose effect than regular sugar. |
Total Sugars vs. Added Sugars: The Critical Distinction
One cup of plain unsweetened yogurt may show 12 g of total sugars. Every gram of that comes from lactose — the sugar naturally present in milk. The manufacturer added nothing. Now take a flavored vanilla yogurt: it might show 28 g total sugars with 17 g listed as added sugars. Those 17 g represent sweeteners the manufacturer introduced to make the product taste better. The remaining 11 g came from the milk itself.
Before 2020, the label showed only total sugars — one combined number that made it impossible to distinguish a naturally sweetened food from a heavily processed one without reading the full ingredients list. The new mandatory added sugars line, with its own % DV against a 50 g/day reference, closes that gap entirely.
The 50 g Added Sugars Daily Value
| 50 gAdded Sugars Daily Value | 30–40 gAdded sugars in one 12 oz soda | 20–25 gAdded sugars in one flavored yogurt |
A single 12 oz can of regular soda typically delivers 30–40 g of added sugars — 60–80% of the daily value in one beverage. One flavored yogurt can account for 40–50% of the daily limit. One serving of sweetened breakfast cereal often delivers 25–30%. These are not edge cases — they are mainstream products consumed daily by millions of people who have never compared their added sugars intake against the 50 g daily value.
The % DV for added sugars makes this comparison instant. Any food delivering 20% DV or more for added sugars in a single serving is a high-sugar product by FDA definition — regardless of whether it is marketed as healthy, wholesome, natural, or low-fat.
Sugar Alcohols: Not Sugar, Not Alcohol, Not Zero Impact
Sugar alcohols — erythritol, xylitol, sorbitol, maltitol, and others — appear under the total carbohydrate section when present. They provide fewer calories per gram than regular sugar (typically 0 to 3 kcal/g versus 4 kcal/g for sugar) and produce a smaller blood glucose response for most people.
They are not calorie-free. They are not zero-impact. Evidence suggests that at high doses, some sugar alcohols — particularly sorbitol and maltitol — cause digestive discomfort in sensitive individuals, including bloating, gas, and loose stools. Erythritol is better tolerated at moderate amounts. Recent research has raised questions about erythritol’s relationship to cardiovascular health at high intake levels — the evidence is preliminary but worth noting. Use hedged language when discussing long-term effects.
Practical reading rule: focus on the added sugars line and its % DV. A high total sugars figure in a food containing dairy, fruit, or whole grains is not automatically a problem. A high added sugars figure in any food is worth paying attention to, regardless of the ingredients used to deliver it.
How do nutrition labels help with weekly meal planning and weight management?
| Quick AnswerNutrition labels become a weekly planning tool when you use % Daily Value across meals rather than evaluating foods in isolation. Tracking fiber, sodium, and added sugars across a full day’s eating gives you an accurate picture of your nutritional intake and the specific places your weekly diet needs adjustment. |
A single food is rarely the problem. The pattern across a full day — and a full week — of eating is what determines nutritional quality. The nutrition facts label is designed for a single product. Using it well means combining information across multiple products to understand how your whole diet adds up.
The Sodium Audit: The Highest-Impact Exercise on This List
Sodium is the most over-consumed mineral in the US diet. The average American adult consumes approximately 3,400 mg per day — nearly 50% above the 2,300 mg Daily Value. Most of that excess does not come from the salt shaker. It comes from packaged and processed foods where sodium is added as a preservative, flavor enhancer, and texture agent.
Run a sodium audit across one typical day of eating. Add the % DV for sodium from every packaged food you consume — breakfast cereal, bread, deli meat, canned soup, condiments, snacks, sauces. For most people, one or two items account for the majority of the daily sodium budget. Identifying those items and replacing them with lower-sodium alternatives is the single most impactful label-reading action for cardiovascular health.
Fiber Targeting: The Second Priority
Most Americans consume significantly less than the 28 g Daily Value for dietary fiber. Evidence indicates adequate fiber intake supports gut microbiome diversity, satiety, blood sugar regulation, and healthy cholesterol levels. Studies suggest that increasing dietary fiber from food sources — not supplements — produces more consistent health benefits than supplemental fiber alone.
For weekly meal planning, the practical target is three or four foods per day delivering 20% DV or more for fiber. Legumes (chickpeas, lentils, black beans), whole grains, vegetables, and certain cereals regularly hit this threshold. A weekly meal plan anchored around these foods reaches the fiber daily value naturally, without counting grams at every meal.
The Three-Number Scan: A Sustainable Daily Habit
Reading every line of every label at every meal is not a sustainable habit for most people. What is sustainable is choosing three priority nutrients — typically fiber, added sugars, and sodium for most US adults — and scanning for those three consistently across every packaged food you buy.
Choose your three based on your personal health context. Managing blood pressure? Sodium and potassium. Building a plant-based diet? Fiber and protein. Reducing sugar intake? Added sugars and total carbohydrates. The label covers all of these. Pick the three that matter most for your situation and build the scanning habit around those.
Nutrition Labels for Children
For children aged 1 to 3, % DV references are calculated against a 1,000-calorie diet rather than 2,000 calories. Products specifically marketed for this age group carry pediatric-specific labels. For children aged 4 and older, the standard adult label applies. When evaluating packaged children’s foods — snacks, cereals, pouches, crackers — the same 5%/20% rule applies with particular emphasis on added sugars, sodium, and saturated fat, which are consistently elevated in products marketed for children.
What MyWeeklyEats Already Did for You
Every meal plan on MyWeeklyEats is built around foods that score well on the criteria this guide has covered: high % DV for fiber, vitamin D, potassium, and calcium; low % DV for sodium, saturated fat, and added sugars. The label-reading work is already done. What the label teaches you to evaluate individually, the meal plan delivers collectively, across every day of the week.
We recommend building your weekly eating around foods that consistently deliver high % DV for the ‘get more’ nutrients and low % DV for the ‘get less’ nutrients — not obsessively, not with a calculator at every meal, but with enough label awareness to make consistently better choices without overthinking any single one.
What changed on the new 2020 FDA nutrition label?
| Quick AnswerThe 2020 FDA label update made calories larger and bolder, added a mandatory ‘added sugars’ line with % DV, replaced vitamins A and C with vitamin D and potassium, updated daily values for fiber and sodium, adjusted serving sizes to reflect actual consumption, and introduced dual-column formatting for certain package sizes. |
The nutrition label most people memorized was created in 1994. It remained largely unchanged for over two decades while nutrition science, eating patterns, and our understanding of public health risks evolved significantly. The 2020 update addresses that gap — but because the transition was gradual, many people are still reading a 2020 label through a 1994 framework.
Timeline: When the New Label Took Effect
The FDA finalized the new label rules in May 2016. Large manufacturers — those with $10 million or more in annual food sales — were required to comply by January 1, 2020. Smaller manufacturers had until January 1, 2021. By mid-2021, the updated label appeared on the vast majority of packaged foods in US stores. If a product still shows the old format, it is likely a small-manufacturer item or an older inventory run.
The Biggest Change: Added Sugars Become Mandatory
Before 2020, the total sugars line on a nutrition label combined naturally occurring sugars with manufacturer-added sugars into a single undifferentiated number. A consumer reading that label had no way to know whether the sugar in their food came from whole fruit in the recipe or from high-fructose corn syrup added during processing — without reading the ingredients list line by line.
The new mandatory added sugars line with its own % DV (against 50 g/day) is the most significant public health improvement in the label’s history. It makes the distinction visible at a glance and gives consumers an actionable number to track against a specific daily limit.
The Vitamin Swap: A, C Out — D, K In
Vitamins A and C were required on the original label because deficiency in both was a documented public health concern in the early 1990s. By the time the label was revised, deficiency rates for both vitamins had dropped substantially across the US population. Requiring them on the label no longer served the same public health purpose.
Vitamin D deficiency is now one of the most widespread nutritional shortfalls in the US — estimates suggest 40% or more of the population has insufficient levels, with particular impact on bone health, immune function, and mood regulation. Potassium is consistently under-consumed, with evidence linking low intake to elevated blood pressure and cardiovascular risk. Replacing the old required vitamins with these two reflects where the actual nutritional gaps exist in the current US population.
Updated Daily Values
The Daily Value for sodium dropped from 2,400 mg to 2,300 mg, aligning the label with the Dietary Guidelines for Americans. Dietary fiber’s Daily Value increased from 25 g to 28 g, recalibrated based on updated reference diet calculations. These changes were not arbitrary — they followed the most current federal nutrition guidance available at the time of the update.
Every change from the old label to the new one, side by side:
| Label Element | Old Label | New 2020 Label | Why It Changed |
| Calorie display | Standard type size | Larger, bolder — most prominent number on label | Calories were the most-sought data point but the hardest to find. Legibility was the top consumer complaint in FDA research. |
| Serving size | Recommended amount (1993 data) | Realistic consumed amount (updated survey data) | A 1993-era serving of ice cream was 1/2 cup. Most people eat 2/3 cup. The label now reflects actual consumption, not aspirational portions. |
| Calories from fat | Shown as separate line | Removed entirely | Research showed fat type (saturated vs. unsaturated) matters far more than total fat grams. The line was removed to reduce confusion and shift focus to fat quality. |
| Added sugars | Not shown separately | Mandatory separate line with % DV | The single biggest public health improvement in the label’s history. Consumers can now distinguish naturally occurring sugar from manufacturer-added sugar at a glance. |
| Vitamin A | Required | Optional (no longer required) | Vitamin A deficiency became rare in the US population. Removing it freed space for more relevant public health nutrients. |
| Vitamin C | Required | Optional (no longer required) | Same reasoning — US deficiency rates dropped dramatically. The label reflects where nutritional gaps actually exist today. |
| Vitamin D | Optional | Required | Vitamin D deficiency is now one of the most common nutritional shortfalls in the US. The FDA moved it to required status to increase consumer awareness. |
| Potassium | Optional | Required | Under-consumed by most Americans and linked to blood pressure regulation. Required to highlight a widely ignored nutritional gap. |
| Sodium Daily Value | 2,400 mg | 2,300 mg | Updated to align precisely with the Dietary Guidelines for Americans, 2015–2020 and carried forward in subsequent editions. |
| Fiber Daily Value | 25 g | 28 g | Recalibrated based on updated 2,000-calorie diet reference amounts and current nutrition science on fiber adequacy. |
| Dual-column format | Not available | Available for certain package sizes | Packages that could reasonably be consumed in one or two sittings now show per-serving AND per-package nutrition simultaneously — eliminating the multi-serving math trap. |
Source: FDA ‘Changes to the Nutrition Facts Label,’ accessed 2025. Verify all figures against fda.gov/food/new-nutrition-facts-label before publishing.
The Bottom Line: Three Habits That Change How You Eat
Reading a nutrition label fluently comes down to three habits — not eight sections memorized in perfect sequence, not a nutrition degree, not an hour of analysis at every grocery trip. Three habits, applied consistently, compound into a meaningfully better diet over time.
First: always check serving size before every other number. One misread serving size invalidates every calorie, gram, and percentage that follows. This takes three seconds. It changes everything.
Second: use the 5%/20% DV rule on every label, for both the nutrients you want more of and the ones you want less of. High % DV for fiber and potassium is a benefit. High % DV for sodium and added sugars is a warning. One rule. Every label. Zero math required.
Third: read the first three ingredients. They define what the product actually is beneath whatever the front of the package claims. Whole food near the top is a good sign. Sugar under multiple aliases across the first five ingredients is not.
A weekly meal plan built around these three habits — foods that score well on fiber, vitamin D, potassium, and calcium while staying low on sodium, saturated fat, and added sugars — is exactly what MyWeeklyEats was designed to deliver. The label-reading is already done. The planning is already built. All that is left is eating well, week after week.
| Know What You’re Eating. Every Single Week.Build Your Weekly Plant-Food Meal Plan on MyWeeklyEats.comWe’ve already done the label-reading, the fiber-tracking, and the meal-planning for you. |
All nutritional data referenced from USDA FoodData Central and FDA Nutrition Labeling regulations (21 CFR 101.9). Daily Value figures reflect Dietary Guidelines for Americans 2020–2025. This content is for educational purposes only and is not intended as medical or dietary advice.